


My interest in genealogy started when trying to recognize the ancestors in photos in our family house. The first task was to create a family tree with my ancestors' photos, and the resulting plot is shown in the following figure.

MyHeritage Family Tree Builder was very useful for organizing the data and producing charts and reports. As I was organizing my ancestors' photos, my interest in their genealogy grew together with the need for better ways to visually represent the information. Since then, I've been using the R programming language and the ggplot2 package to create alternative ways to express my genealogical records. I've created a series of plots that provide insights into different aspects of my ancestry. The plots are generated from the data available in a Gedcom file exported from the MyHeritage Family Tree Builder tool. I discuss what motivated the plots and illustrate their potential by analyzing my family tree in the following pages.
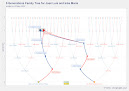
The first of such plots is a Timeline representation in which their Council of birth colors individuals. The following plot shows a five generations timeline for my ancestry. Spouses are connected by a line that indicates the date of their marriage; wives are on top and husbands on the bottom. Their child is at the midpoint between their bars.
My bar is green up to the date of my marriage and then is grey without a border to indicate that I am still alive. We can see that the majority of the individuals are from Porto and Lisbon (the green and red bars), but there are also other less frequent origins, such as the ancestor from Açores in orange and the one from Faro in blue.
Females seem to live longer than males, as in my parents' case, which shows that my mother was born before my father and lived much longer. It is also possible to see that some individuals married relatively late, as is the case of António Moura Borges (the second bar from the bottom).
The plot can be generated for any number of generations and by city or region instead of the council.

Below is a six generations timeline colored by region. As the number of generations increases, it is better to color the bars per region to reduce the number of necessary colors.
For an individual to be represented, at least his name must be known. A light grey and borderless rectangle indicate unknown dates. For example, only the birthdate is known of the topmost woman, Petronilha Sousa. About Francisca Novais de Sequeira we only know her name.
The absence of the vertical line connecting spouses indicates no information about their marriage. An example of that is Petronilha and Manuel Sousa.

The timeline analysis raised questions about the longevity of the individuals. The following plot (the Ages plot) has the individuals aligned by age to promote the comparison of their longevity; males are on the right panel and females on the left panel. The first generation (G1) represents my parents, and the blue dot represents me since I am the only male child. In each generation, individuals are aligned from bottom to top from the paternal to the maternal lineage. I believe the plot provides a nice overview of longevity, marriage date, and age of paternity.
My mother died at 94 years old, being the represented ancestor with more extended longevity. My father died almost the same age as his father, which I wasn't aware of before seeing the plot. Females lived, on average, 73.3 years while males lived 67.6.
Interestingly, my great-grandfather, António de Moura Borges, had a single child at almost 50 years old, and my great-great-grandfather João Ferraz de Macedo was well over 60 when he married. António Pinto de Aguiar married at eighteen and all other males married after twenty years old.

Muito bom trabalho! Com muitas informações da sua linha direta, e quase todos com fotos. Lindo de se ver.
ReplyDeleteParabéns!